Analysis GBP/USD 5M
The GBP/USD currency pair continued to move on Tuesday, with minimal volatility and no macroeconomic or fundamental background. Therefore, traders had neither grounds nor desire to open positions. The technical picture has not changed, and there is no news to analyze.
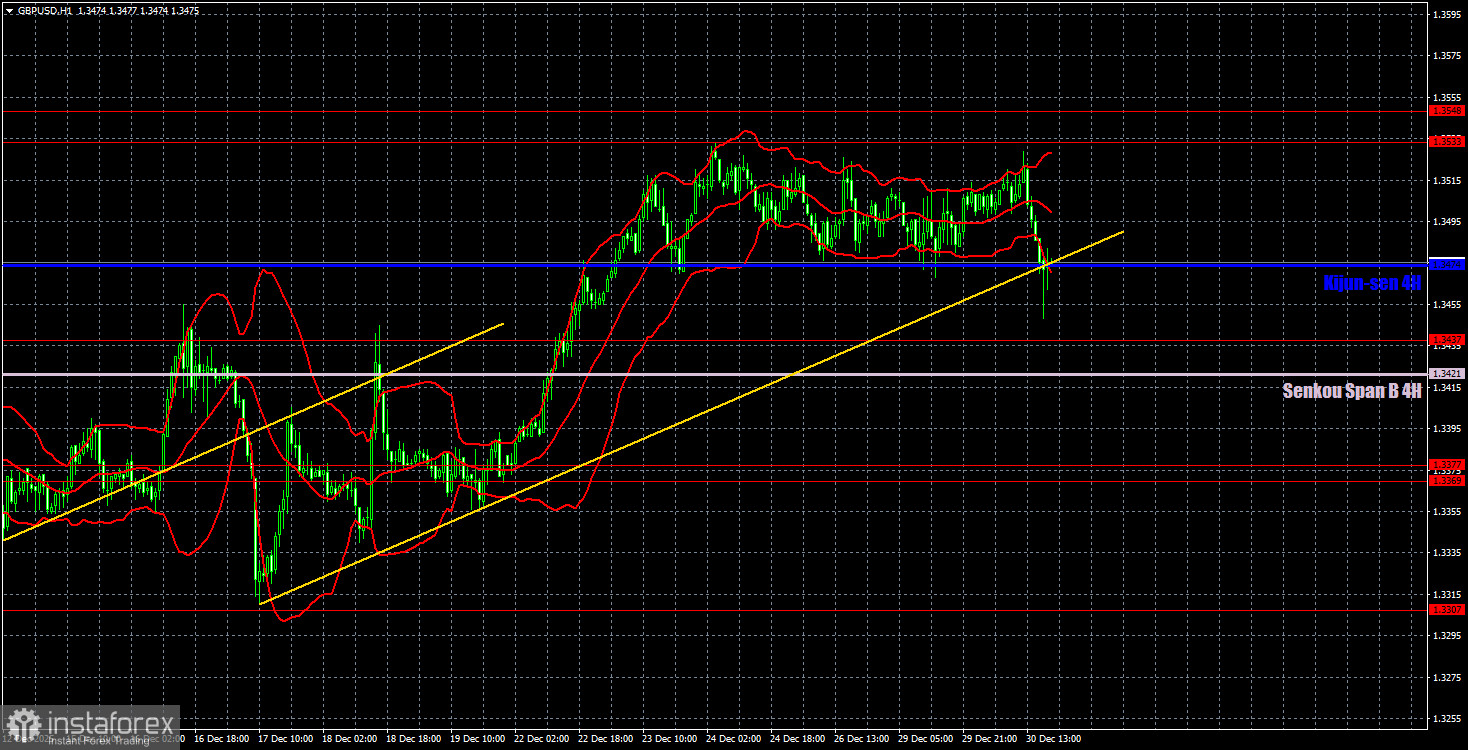
An upward trend persists on the hourly timeframe despite the trendline being broken. The pair failed to settle below the critical line. Thus, technically, the pound's upward movement can resume at any moment. It is unlikely to resume this week, however, as the events calendar is empty and the New Year holidays continue worldwide. Nevertheless, the pair's medium-term prospects are clear. Even if the price breaks the Kijun-sen line, it will at most lead to a decline to the Senkou Span B line. Recall that any flat tends to fall out of the overall trend. In other words, a trendline break inside a flat is not a signal of a trend change.
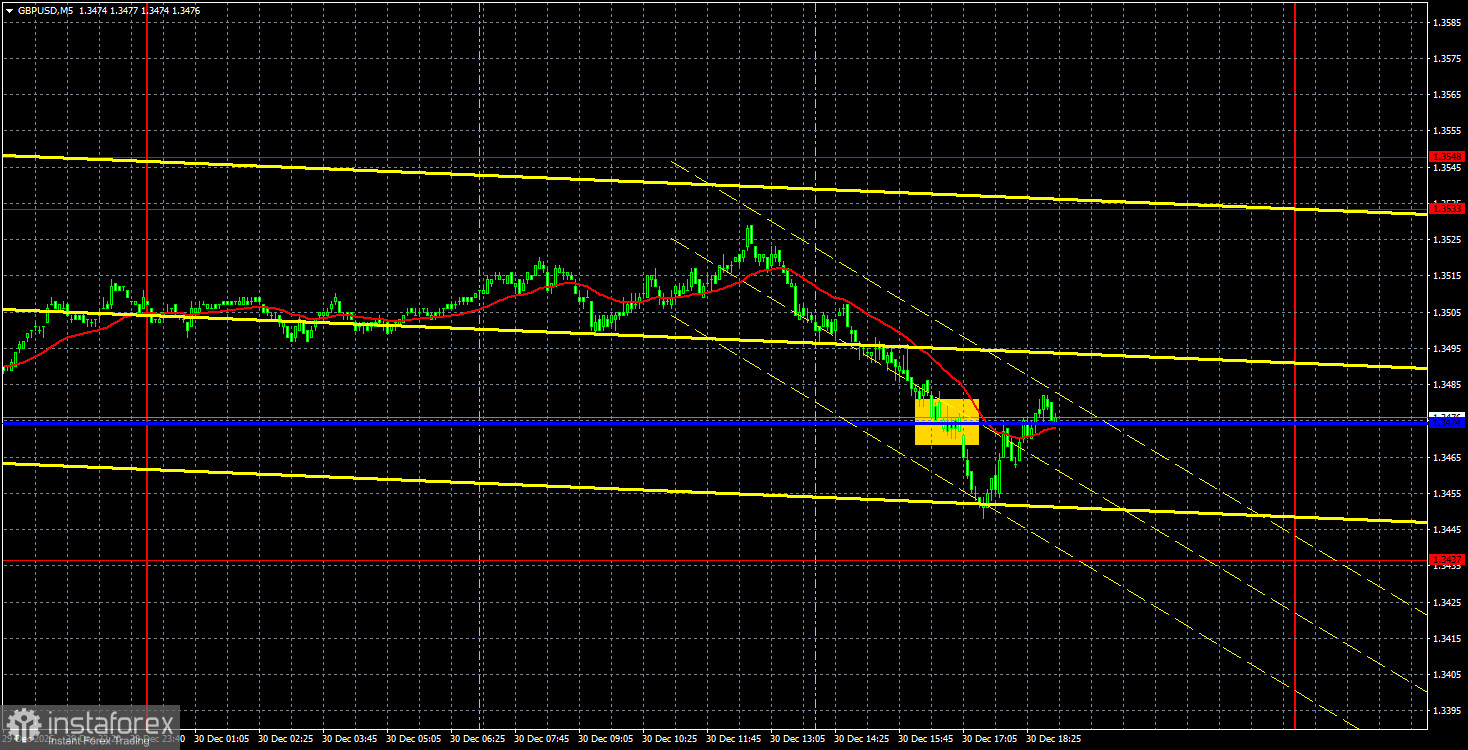
On the 5-minute timeframe, one trading signal was generated on Tuesday, but it produced no profit. During the American session, the pair settled below the critical line for an hour but could not continue the decline.
COT Report
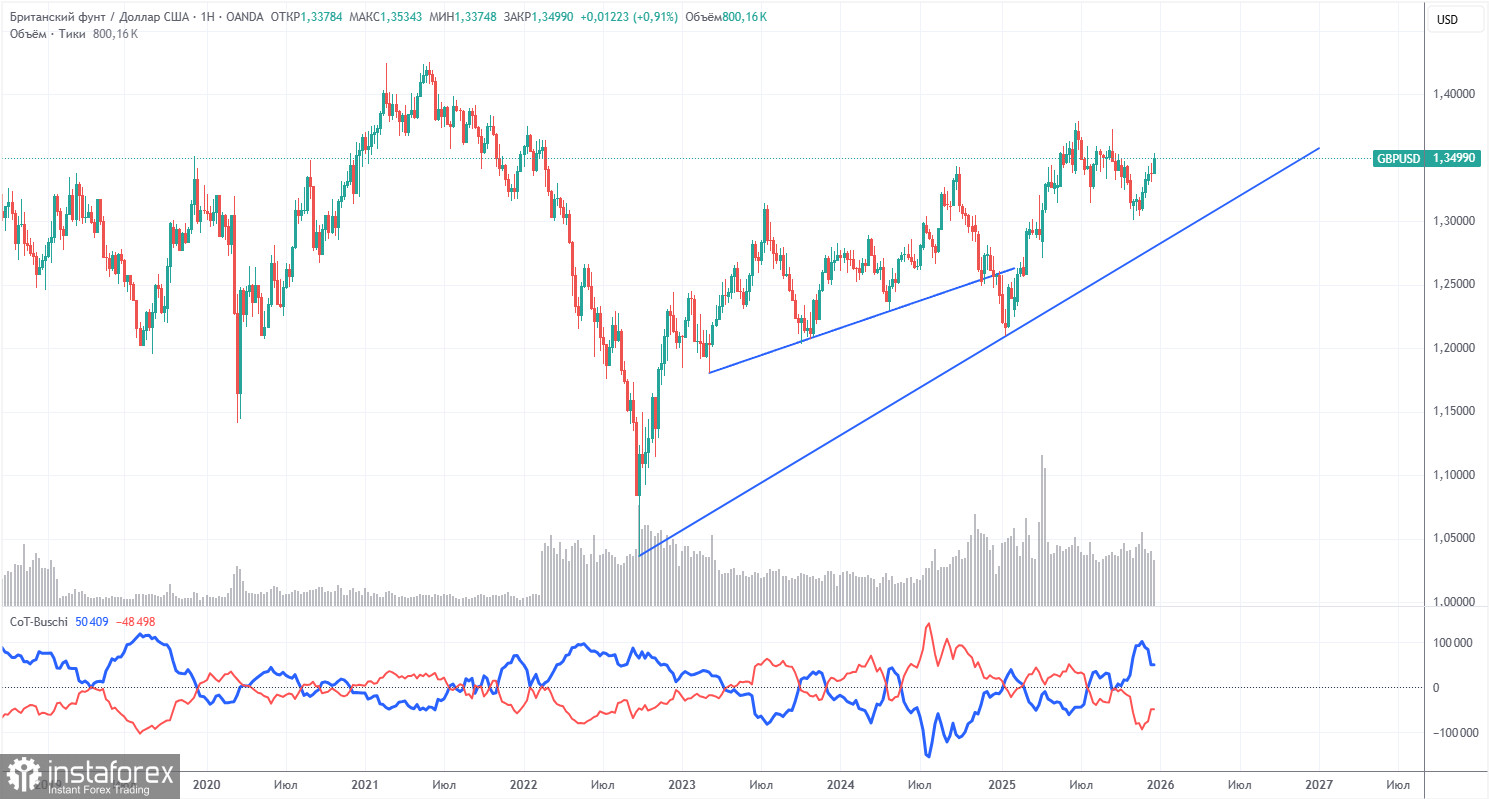
COT reports for the British pound show that commercial traders' sentiment has been changing constantly in recent years. The red and blue lines representing net positions of commercial and non-commercial traders frequently cross and are usually close to zero. Currently, the lines are diverging, but the dominant players are now non-commercial traders with short positions. Speculators increasingly sell the pound, but, as noted, it does not matter how low the demand for the pound is. Demand for the US dollar is often even lower.
The dollar continues to decline due to Donald Trump's policies, as seen clearly on the weekly timeframe (illustration above). The trade war will continue in one form or another for a long time. The Federal Reserve will, in any case, cut rates over the next 12 months. Demand for the dollar will fall. According to the latest COT report (dated December 16) for the British pound, the "Non-commercial" group opened 1,600 BUY contracts and closed 25,400 SELL contracts. Thus, the net position of non-commercial traders increased by 27,000 contracts over the week.
In 2025, the pound rose significantly, but the reason was one: Donald Trump's policy. Once this cause is neutralized, the dollar may start to strengthen, but when that will happen is unknown.
Analysis GBP/USD 1H
On the hourly timeframe, the GBP/USD pair continues to form an upward trend, but the market is currently in a holiday pause and is flat. We believe that the pound's mid-term rise will continue regardless of the local macroeconomic and fundamental background. The trend for the pound remains upward on almost all timeframes. However, until January 5, we are unlikely to see interesting market moves.
For December 31, we highlight the following important levels: 1.2863, 1.2981–1.2987, 1.3042–1.3050, 1.3096–1.3115, 1.3201–1.3212, 1.3307, 1.3369–1.3377, 1.3437, 1.3533–1.3548, 1.3584. The Senkou Span B line (1.3421) and Kijun-sen (1.3474) may also be sources of signals. It is recommended to move the stop loss to breakeven after the price moves 20 pips in the intended direction. Ichimoku lines may shift during the day and should be considered when determining signals.
No important events or reports are scheduled in the UK or the US on Wednesday. The pair will continue to trade very weakly, and the possible direction can only be determined by technical factors.
Trading Recommendations:
Today, traders may consider selling if the price settles below the critical line with targets at 1.3437 and the Senkou Span B line. Long positions become relevant on a bounce from the Kijun-sen line with targets at 1.3533–1.3548.
Explanations of the illustrations:
- Support and resistance levels – thick red lines around which movement may end. They are not sources of trading signals.
- Kijun-sen and Senkou Span B lines – Ichimoku indicator lines transferred to the hourly timeframe from the 4-hour. They are strong lines.
- Extreme levels – thin red lines from which the price previously bounced. They are sources of trading signals.
- Yellow lines – trend lines, trend channels and any other technical patterns.
- Indicator 1 on COT charts – the size of the net position of each category of traders.