Analysis of GBP/USD 5M
The GBP/USD currency pair also moved lower throughout Thursday, as UK business activity indexes for May showed rather negative results. The services sector recorded a decline of nearly 5 points – from 52.7 to 47.9. There were no changes in the manufacturing sector compared to April. However, the services sector alone was sufficient to put the British currency back under market pressure. Traders' reaction was restrained, and the pound sterling has generally been trading higher this week, unlike the euro. However, growth is cautious, as there are no facts-based positive news regarding the situation in the Middle East. Therefore, the British currency is unable to gain any upward momentum.
From a technical standpoint, the downward trend is maintained on the hourly time frame. This trend may end if the pair surpasses the Senkou Span B line. Geopolitics frequently alters market dynamics, so the direction of movements in the foreign exchange market is constantly changing. This week, traders paid little attention to important UK unemployment and inflation reports, but they did react to the business activity indexes. For now, the pair is correcting within the downward trend.
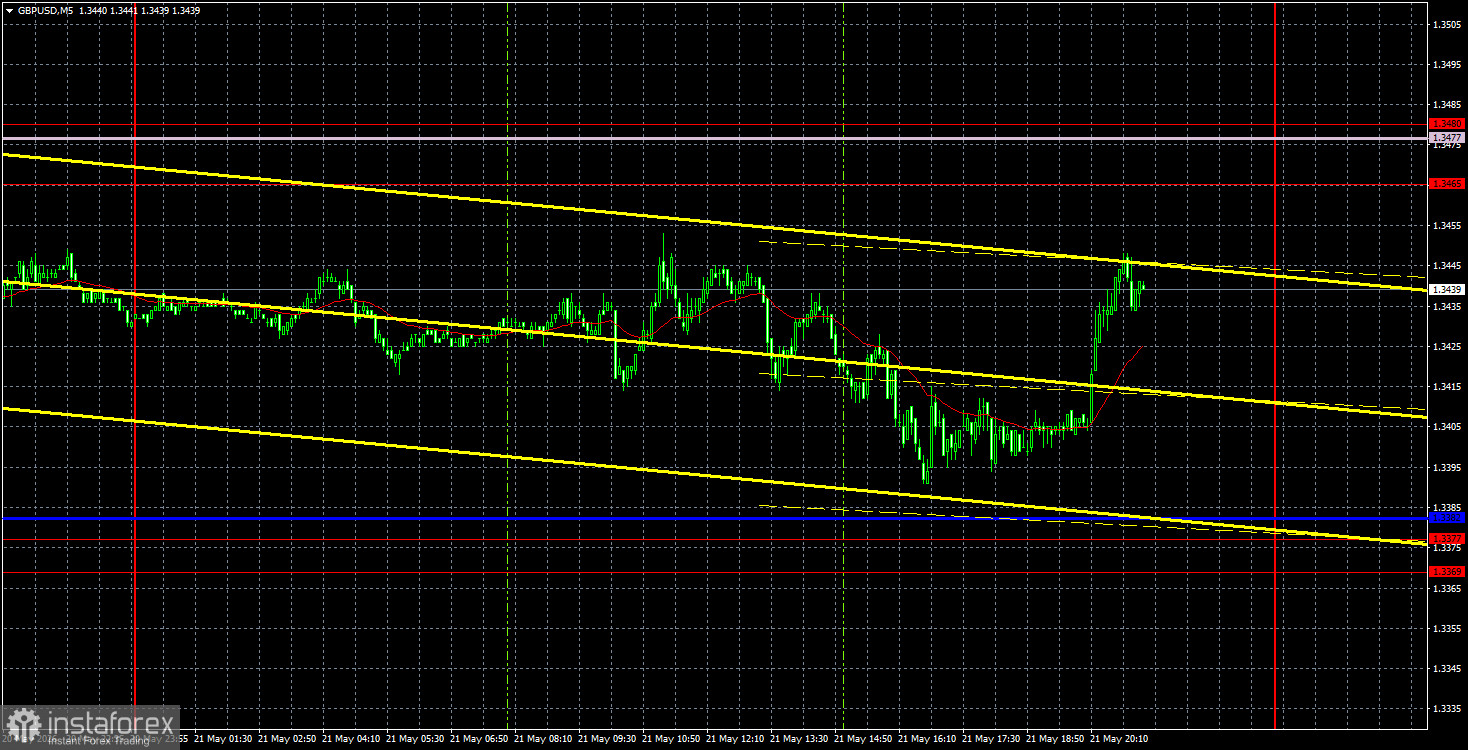
On the 5-minute time frame, no trading signals were generated on Thursday. The Kijun-sen line dropped further below Thursday's levels, so it was not activated by the price during the day. Thus, there were no grounds for traders to open positions on the pound yesterday.
Analysis of GBP/USD 4H
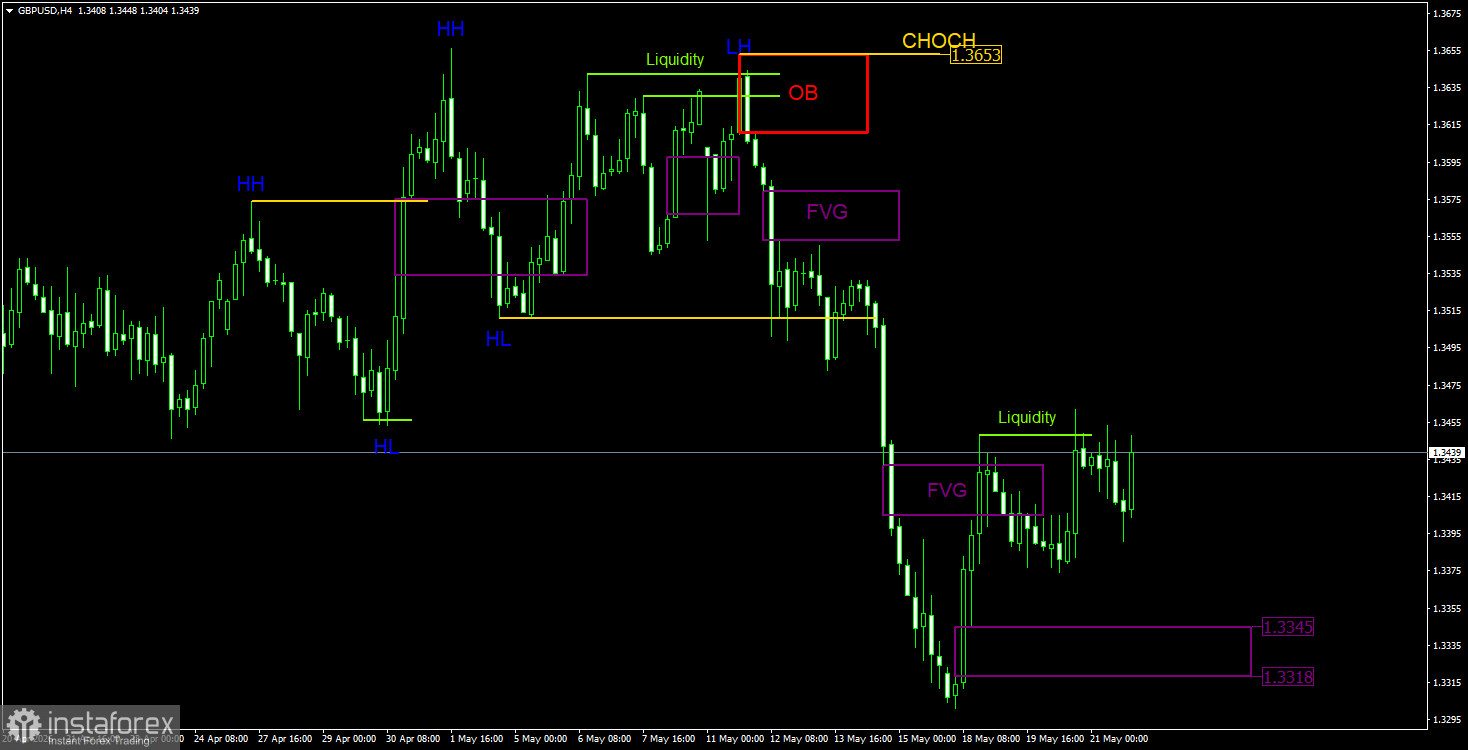
On the 4-hour time frame, the pound sterling is also within a downward trend following the breakdown of the upward structure last week. The price has literally plummeted 300 points, and the CHOCH line is at 1.3653, which cannot yet be moved lower. During last week's decline, several "bearish" FVGs can be identified, but we focused only on the most recent one. On Tuesday, the price completely filled the indicated pattern and received a reaction to it. However, the reaction was very weak, and the decline did not last long. The "bullish" FVG in the 1.3318-1.3345 area was not triggered on Wednesday or Thursday. Yesterday, the price removed sell liquidity and began a new decline. No new bearish patterns emerged, but a sell signal was generated for the euro. Then, a warning of a potential upward reversal was indicated by the removal of buy liquidity.
Analysis of GBP/USD 1H
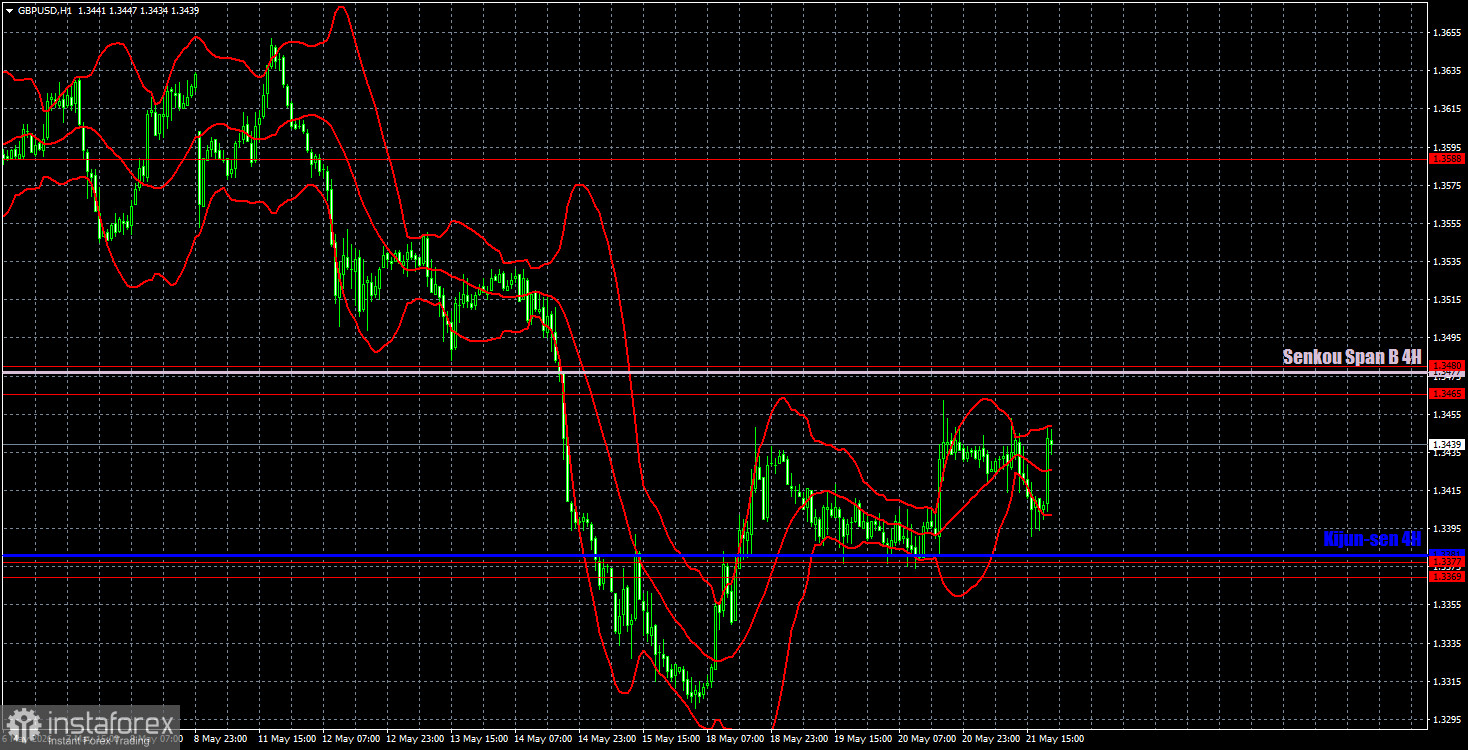
On the hourly time frame, the GBP/USD pair is attempting to initiate a new upward trend, but a downward trend still persists below the Senkou Span B line. The macroeconomic and fundamental background remains largely uninfluential on the pair's movements, while geopolitics regularly provokes price fluctuations in both directions. We do not believe that without a real escalation in the Middle East, the dollar will continue to strengthen. On Monday, positive news from the White House sent the dollar down by 100 pips. Wednesday saw a repeat of this situation.
As of May 22, we highlight the following important levels: 1.3096-1.3115, 1.3179-1.3187, 1.3369-1.3377, 1.3465-1.3480, 1.3588, 1.3671-1.3681, 1.3751-1.3763. The Senkou Span B line (1.3477) and the Kijun-sen line (1.3381) may also serve as signals. It is recommended to set the Stop Loss level to break even if the price moves in the right direction by 20 pips. The lines of the Ichimoku indicator may shift during the day, which should be considered when determining trading signals.
On Friday, a retail sales report is scheduled for publication in the UK, and in the US, the second estimate of the University of Michigan consumer sentiment index will be released. Both reports are unlikely to be noted by the market, so the pair's movements during the day will once again depend on geopolitical news.
Trading Recommendations:
Today, traders can open short positions targeting 1.3369-1.3377 when the price bounces from the 1.3465-1.3480 area. Long positions can be opened if the price stabilizes above the area of 1.3465-1.3480, targeting 1.3588. On the 4-hour time frame, the formation of new patterns should be anticipated.
Explanations for the Illustrations:
- Price levels of support and resistance – thick red lines where the movement may end. These do not serve as sources of trading signals.
- Kijun-sen and Senkou Span B lines – Ichimoku indicator lines transferred from the 4-hour to the hourly timeframe. These are strong lines.
- Extremum levels – thin red lines where the price previously bounced. These serve as sources of trading signals.
- Yellow lines – trendlines, trend channels, and any other technical patterns.
- CHOCH – change of trend structure.
- Liquidity – Stop Loss, pending orders that market makers use to build their positions.
- FVG – Fair Value Gap. Price moves very quickly through these areas, indicating a complete absence of one side in the market. Subsequently, the price tends to return and react to such areas in continuation of the main trend.
- IFVG – Inverted Fair Value Gap. After returning to such an area, the price does not react to it; it breaks impulsively and then tests it from the other side.
- OB – Order Block. The candle on which a market maker opened a position with the aim of gathering liquidity to form their position in the opposite direction.